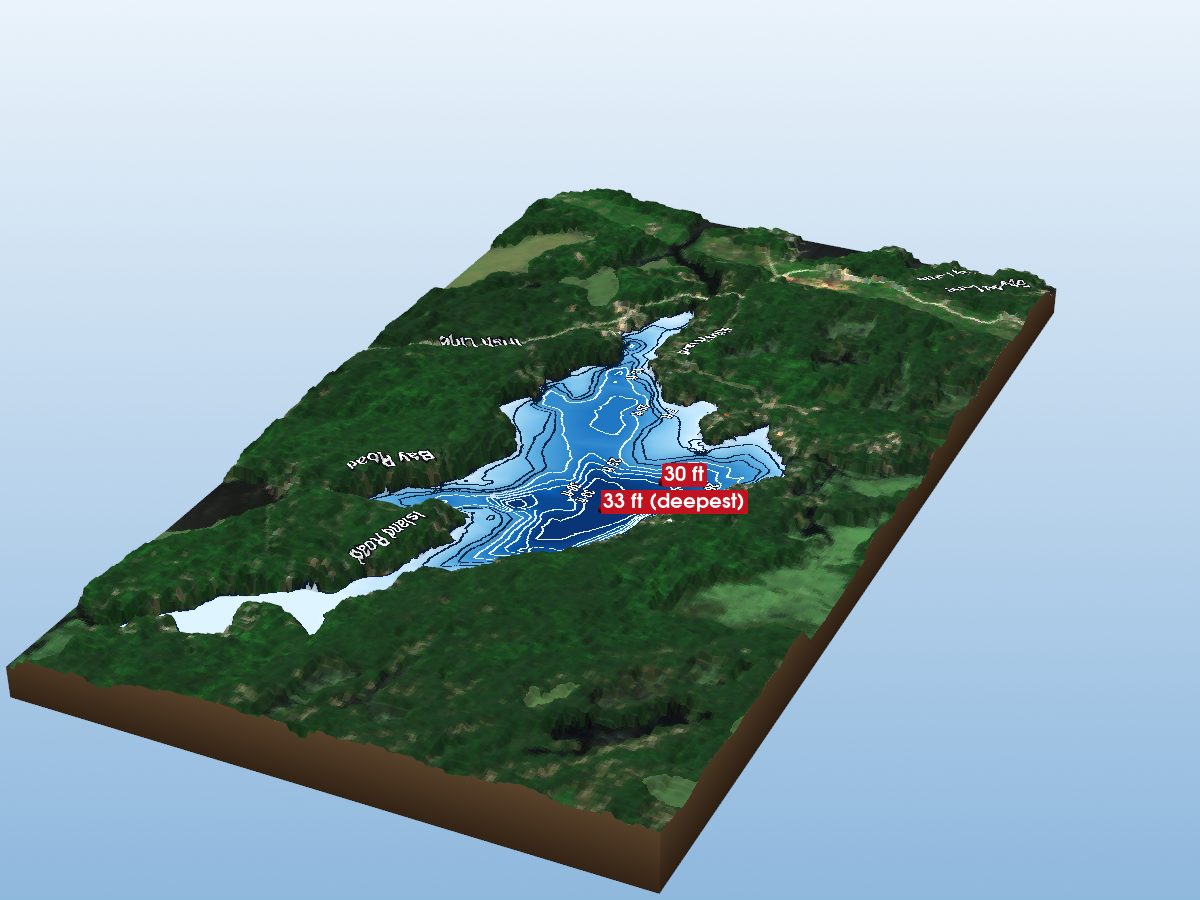
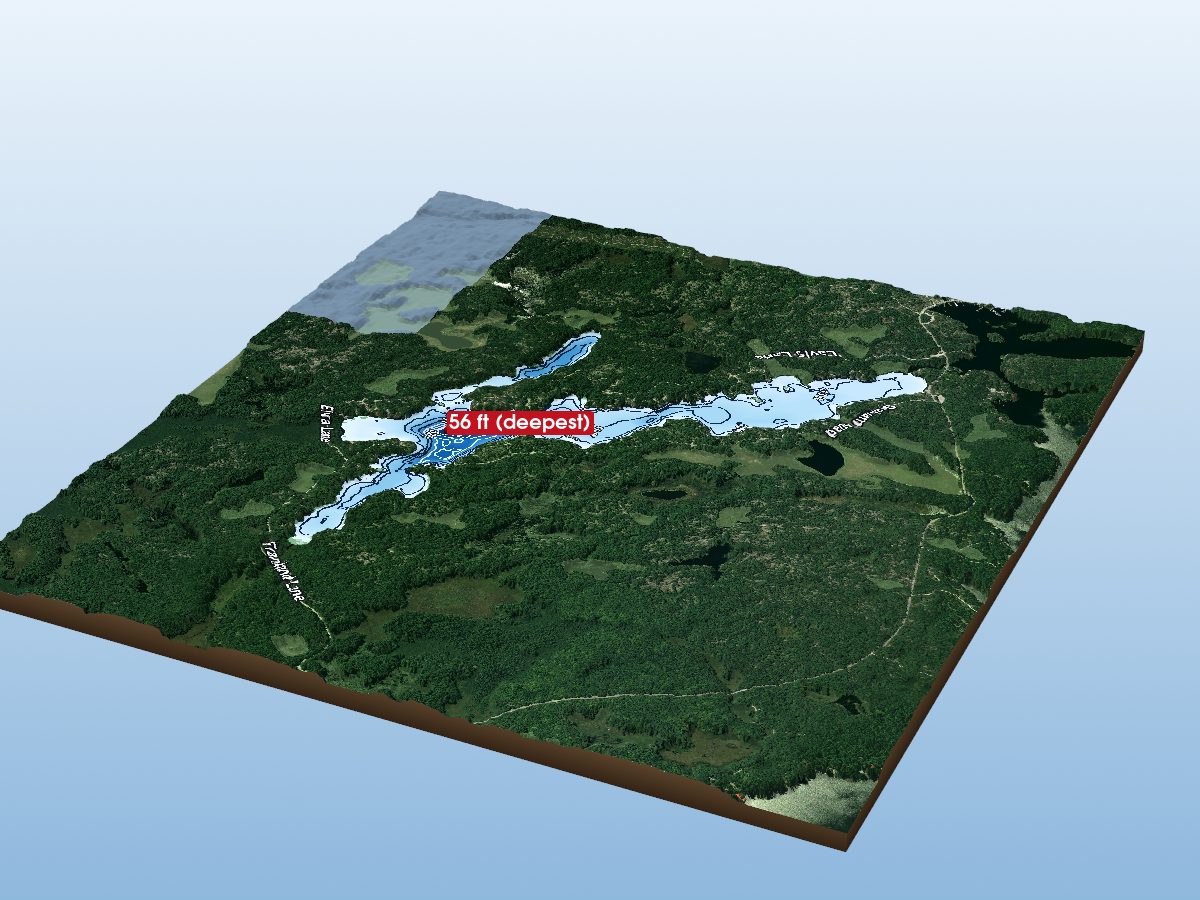
Lake St. John
20 ft
Get directions
Depth scale
Survey readout
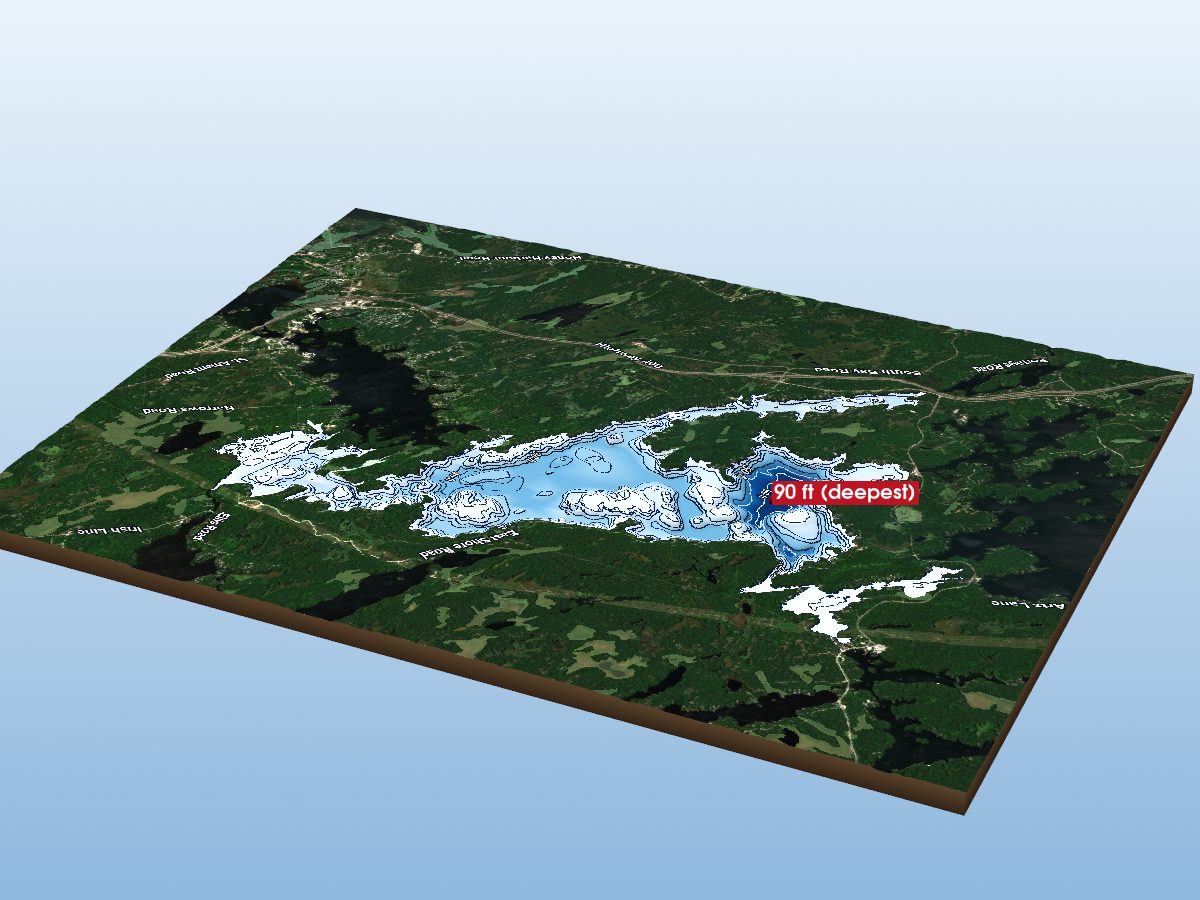
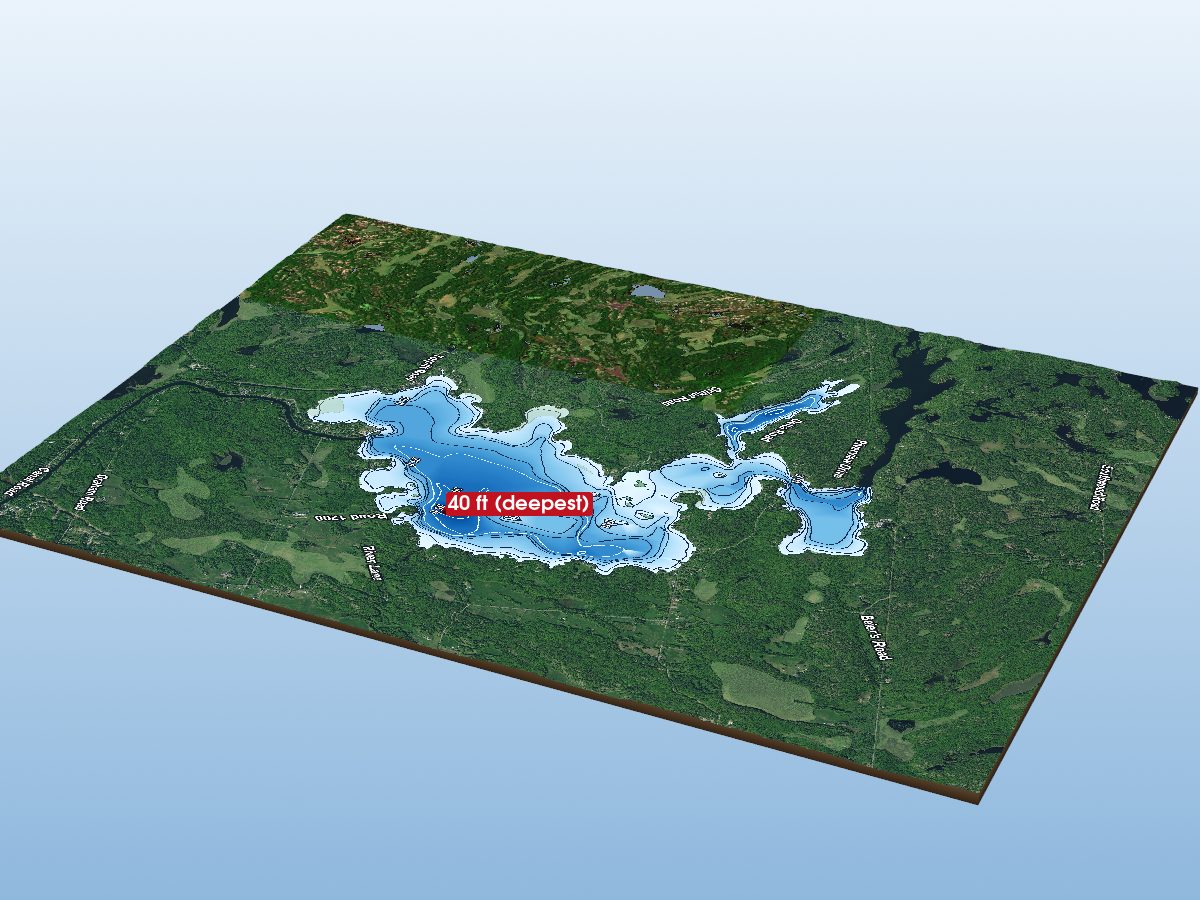
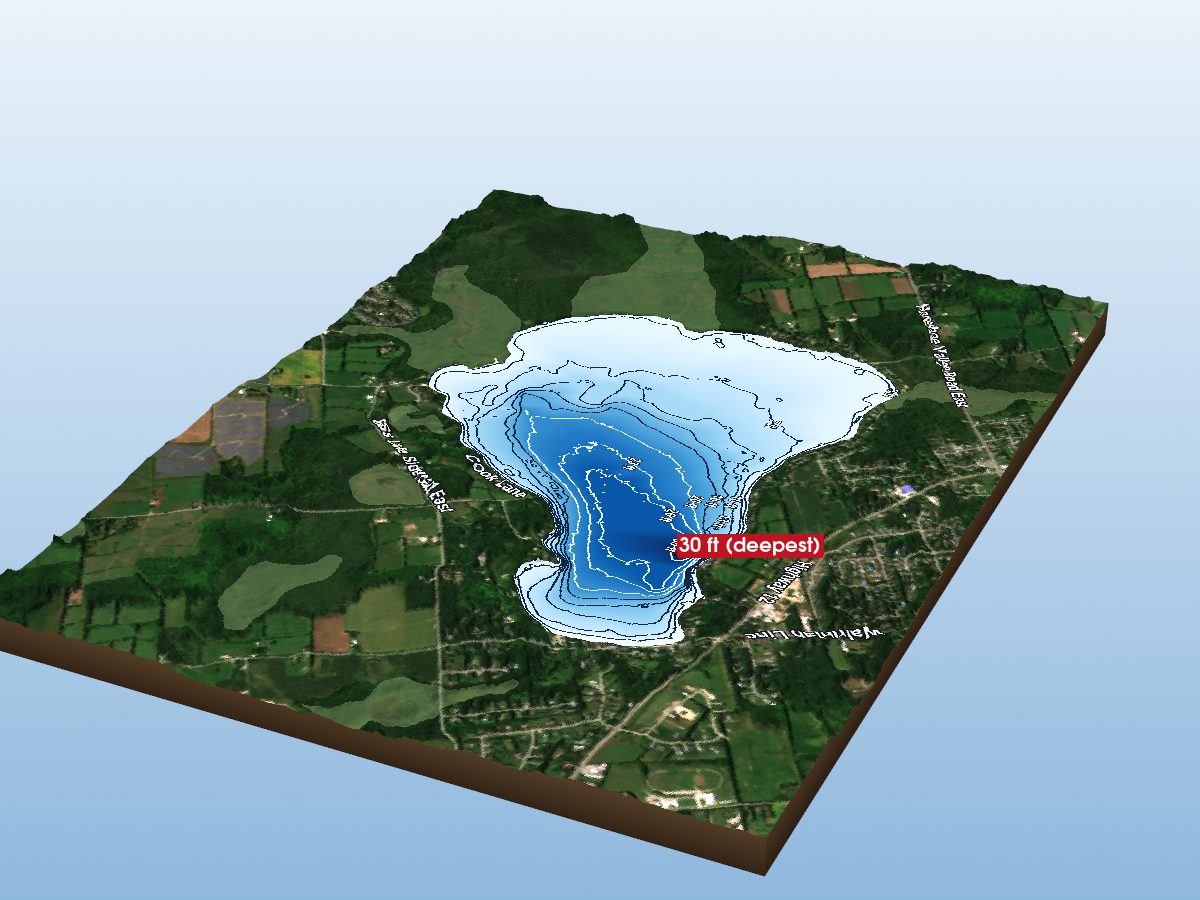
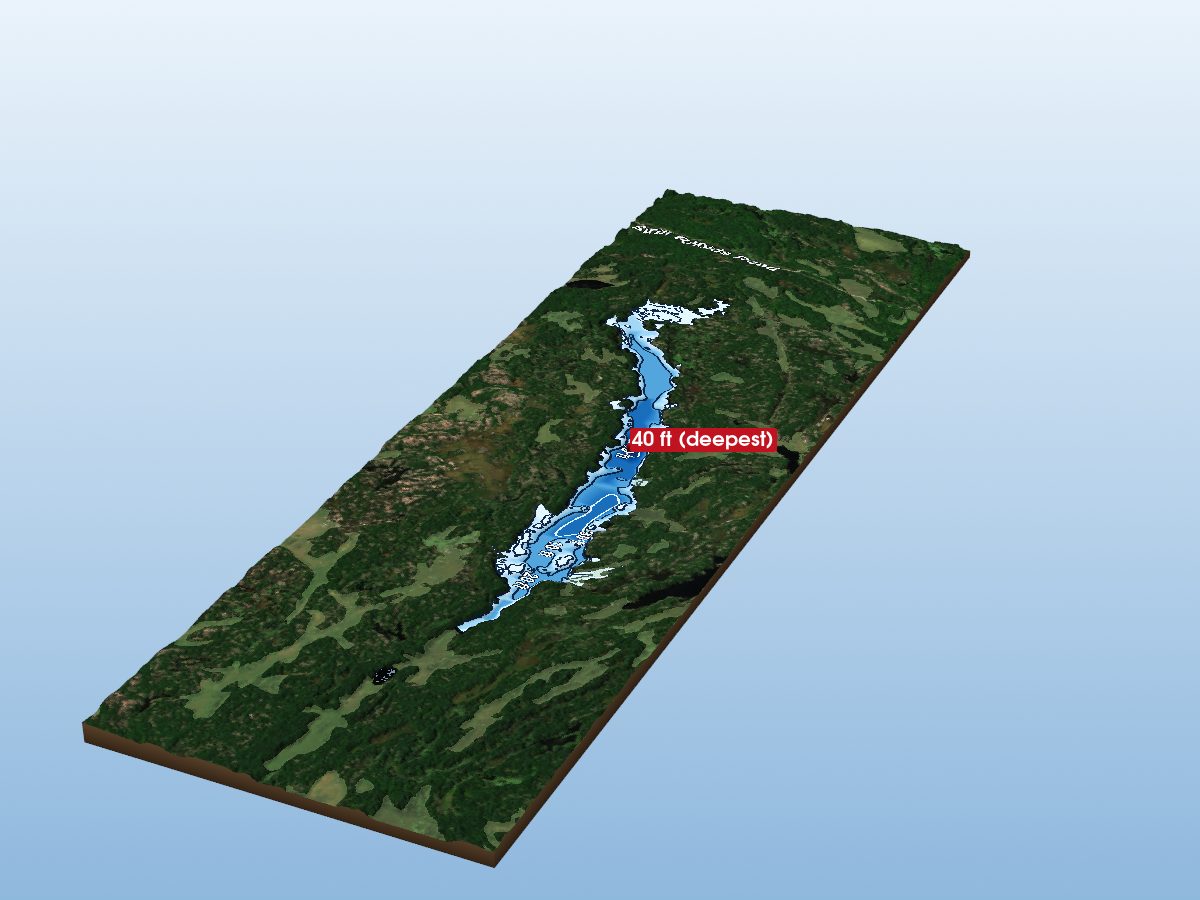
Lake St. John is mapped to a depth of 6.1 m (20 ft) on the Ontario MNRF survey and covers about 657 ha (1,624 acres) in Simcoe County, Ontario. Depths come from the Ontario MNRF survey of 1968.
Measured from the Ontario MNRF bathymetry survey.
- Deepest mapped contour
- 6.1 m (20 ft)
- Survey year
- 1968
- Surface area
- 657 ha (1,624 acres)
- Shoreline
- 16.8 km (10.4 mi) · irregular
- Fishing access
- No MNRF fishing access point listed within 100 m (the list is incomplete)
- Borders
- Mnjikaning First Nation 32 · First Nation reserve · 40% of shoreline · First Nation rules may apply
Additional depth details3 contours
- Contour depths
- 0–6.1 m (20 ft)
- Deep-spot markers
- 6.1 m (20 ft)
Provenance
Sources: Ontario MNRF / LIO Bathymetry, OpenStreetMap (ODbL), Contains information licensed under the Open Government Licence – Ontario, Contains modified Copernicus Sentinel data (Sentinel-2), processed by ontariolakedepths.com, Copernicus DEM 30 m (© DLR/Airbus).
⚠ Not for navigationSpot an error? Send a correction
Map details & sources5 sources
All layers registered to one bounding box; positions in WGS 84.
Survey-derived depth contours drape over Copernicus DEM (30 m) elevation, with a Copernicus Sentinel-2 satellite basemap and OpenStreetMap shoreline. Colour shows surveyed depth; dark lines are the survey's own isobaths.
- Coordinates
- 44.68946, -79.32442
- MNRF lake ID
- 17-6328-49494
- Vertical exaggeration
- 3.6× below the waterline; land at true scale
- Basemap
- Copernicus Sentinel-2 · ESA, via Microsoft Planetary Computer
- Model size
- 1.8 MB
Check the source: this lake’s record (17-6328-49494) in the Ontario MNRF bathymetry index, and the contour line layer the map is drawn from (Land Information Ontario open data, Open Government Licence – Ontario). Survey year: 1968. This model was built 2026-10-01. Depths between contours are interpolated, not measured.
Paddling
Paddling Index methodology v1.0 · calculated 2026-09-16Lake St. John has a partly natural setting, notable open-water exposure, nearby higher-volume roads.
Why this score?5 components
Included in the index
| Component | Rating | Points of weight | Measurement |
|---|---|---|---|
| Natural setting | Good | 18.8 of 43 | 60% natural land cover within 150 m of shore (32% forest, 25% wetland; 28% developed) |
| Geometric wind exposure | Mixed | 7.0 of 36 | mean fetch 2,807 m · 0% of sampled water within 500 m of shelter · long fetch in some directions |
| Motor & speed rules | Not modelled | — | Canada publishes vessel motor and speed restrictions as federal legal schedules, not map data, so they are not part of the Ontario index. Check local signage and Transport Canada rules before going out. |
| Public access | Not listed | — | No publicly listed MNRF fishing access point within 100 m of this shoreline. Municipal, private and informal launches are not all in this source, so this is not evidence that access is poor — the component is excluded and the remaining weights are renormalized. |
| Road isolation | Mixed | 8.9 of 21 | nearby higher-volume roads · 77 Ontario Road Network segments within 1.2 km (traffic estimated from road class, not measured) |
Additional paddling considerations
These describe the lake but are not part of the v1 Paddling Index and do not change the number above.
- Wake sensitivity
- Low — wide enough that wakes disperse over most of the lake
- Observed motorized activity
- Unknown — No lake-level measurement of boat traffic is available. Legal permission to operate motors is not evidence of use.
- Wildlife habitat potential
- Moderate — 32% forest and 25% wetland cover within 150 m of shore
- Mapped wildlife habitat
- Mapped — Ontario MNRF has mapped waterfowl staging or nursery areas within 1 km of this lake. These are habitat records from provincial surveys, not animal counts; areas with nothing mapped may still hold wildlife. · Ontario MNRF Wildlife Values Area. Contains information licensed under the Open Government Licence – Ontario.
Compare Ontario lakes by Paddling Index →
Angler catch reports
Fish ON-Line · 2012–2025What anglers say they caught here, logged trip by trip in Ontario’s Fish ON-Line app — most recently in December 2025.
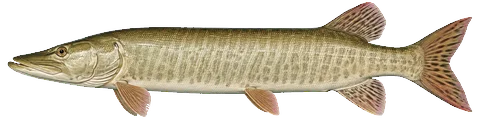
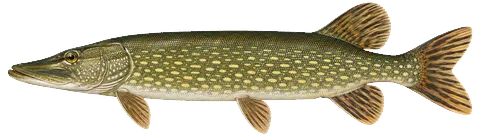
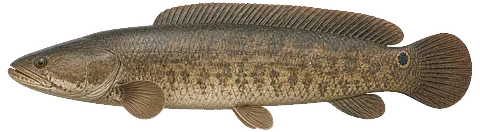
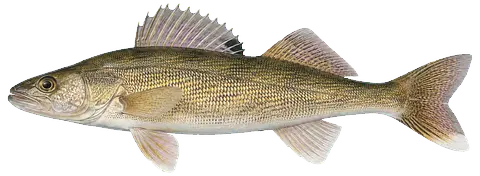
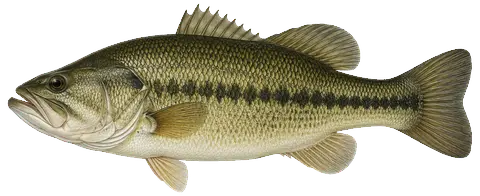


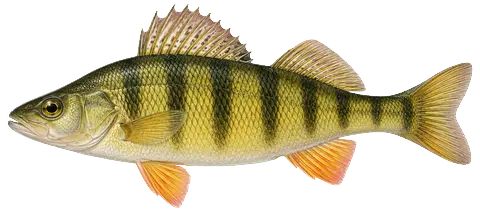
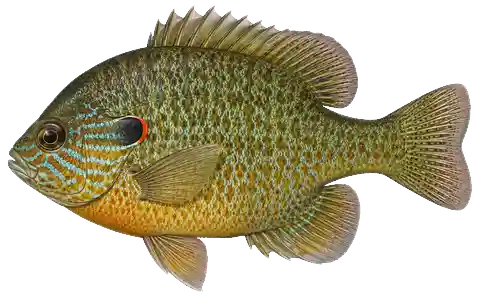
Pictures are sized relative to each other. Illustrations are AI-generated representative adults in everyday colours, not photographs (provenance).
All species & trip details9 species
How people fish it: boat 50% · ice 50%
Catch rate: about 1.7 fish an hour, all species together (28 trips, 143 hours logged)
Kept: 18% of the fish reported; the rest were released
About these fish → the Fish of Ontario guide
Lake St. John — common questions
How deep is Lake St. John?
The deepest contour on the Ontario MNRF bathymetric survey of Lake St. John is 6.1 m (20 ft). That is the deepest depth the historical survey map records, which may differ from the deepest point of the lake itself.
How big is Lake St. John?
Lake St. John covers about 657 ha (1,624 acres) in Simcoe County, Ontario.
Is there public access to Lake St. John?
No fishing access point for Lake St. John appears in the Ontario MNRF fishing access point list (within 100 m of the shoreline). That is not the same as the lake being private -- the MNRF list is incomplete, and many municipal, marina and private launches are not in it.
Do First Nation rules apply on Lake St. John?
Lake St. John has 40% of its shoreline in Mnjikaning First Nation 32, a First Nation reserve. Fishing, boating and access on reserve land and waters can be governed by the First Nation's own rules as well as Ontario's. Check with the First Nation before fishing or launching.